
For over two decades, we have supported public and private institutions in establishing science-based climate and disaster risk management policies, strategies and plans.
Climate and Disaster Resilience
Climate and Disaster Risk Assessment

Geo-spatial Exposure Database

Risk Profile and Atlas
Web-based Knowledge Sharing Platform

Indicator and Hotspots

Information, Education, and Communication Materials

Local Disaster Risk Reduction and Management Plan- LDRRMP

Local Climate Change Action Plan (LCCAP)

Community Disaster Risk Reduction and Management Plan
Managing Complex Emergencies
Integrated Emergency Management System

Disaster Information Management System

SOPs / Emergency Operations Plan

Emergency Operation Center Facility Design

Training Exercises and Drills (TED) for Emergency Response

Roadmap and Tools for Managing Complex Emergencies
Public Service Continuity Plan / Contingency Plan
Climate and Disaster Risk Assessment
This work package involves the following analyses and outputs:
- Natural Hazards include: Climate change, floods, earthquakes and landslides. For coastal cities, flood hazard assessment includes storm surge. Secondary hazards such as liquefaction and fire following earthquakes and post-flood health hazards in terms of gastrointestinal infections.
- Pathological hazards can be included in the context of health crisis management.
- Climate change hazard focus is on assessing mean and extreme seasonal changes in temperature and rainfall under RCP 4.5 and RCP 8.5 scenarios as well as developing temperature and rainfall extreme indices.
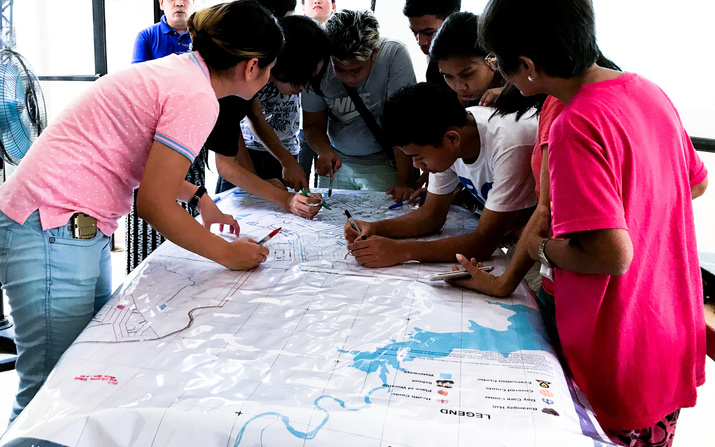
- The CERAM tool is used for participatory workshops with the stakeholders to determine projected impacts on key sectors and develop adaptation and mitigation approaches for sectors at risk.
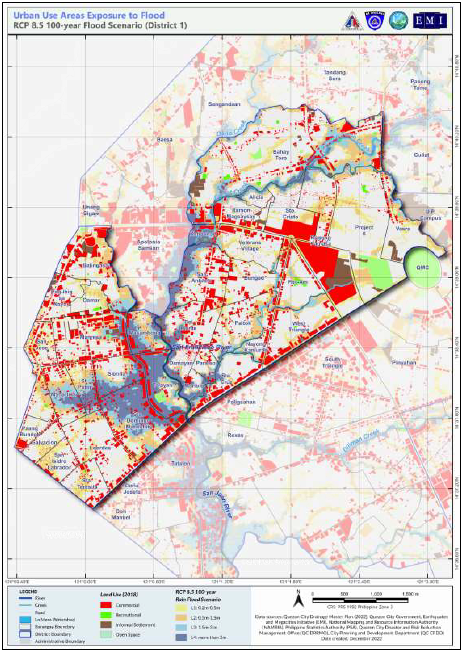
- Flood hazards incorporate the impact of climate change on the RCP4.5 or RCP 8.5 scenario with capability to generate street-level flood susceptibility maps to pinpoint exactly the areas that are flooded in terms of height and possible duration.
- Intensity maps for earthquake hazard will typically be on 110m x 110m resolution. Higher resolution, variable mesh resolution and building level hazard maps can also be generated depending on the availability of soil and surface geological data.
- High resolution city district level maps for earthquake, flood and landslide hazards are generated in 2-D and 3-D format to enable neighborhood and/or community level planning.
- Assessment of impacts of each hazard is undertaken at the neighborhood (or city district) level providing an estimate of the social (i.e., death and injury), material (building damage, critical facilities damage, lifeline damage), and economic losses.
Geo-spatial Exposure Database
This work package involves the following analyses and outputs:
- Develop a data capture tool and guide local authorities in the collection of the data necessary to develop the geospatial exposure database (GSED) for the city. The target is to achieve the highest resolution possible in undertaking the risk assessment for natural hazards, typically building-footprint level resolution.
- The data to be collected includes those available from the various city government departments, as well as those to be requested from relevant national government agencies. Data from open source providers is included. Remote sensing technology is used to complement data and produce DSM and DTM data.
- Consult with the different data holders regarding data organization, structure and metadata collection. Relevant information in hard copy formats is digitized and transformed into editable geographic information system (GIS) formats.
- The parameters of the exposure database needed for the CDRA are fixed by the algorithms of EMI hazard and risk assessment models.
- The data treatment involves checking the collected data for integrity, topology, overlay, completeness, spatial reference and data coherency.
- The database is designed using Unified Modeling Language, and implemented in a GIS platform creating the GSED.
- The architecture, software, and hardware for the GSED platform is determined in consultation with the client and relevant IT specialists of the city government, but will conform to the CDRA data structure requirements to enable the risk assessments.
- To the extent possible, the GSED platform will be integrated with the existing GIS system of the client. The scope of such integration will be agreed upon by the client and EMI, after EMI has evaluated the GIS system and developed recommendations regarding its integration with the GSED platform.
- EMI can use either the ESRI commercial platform or the publicly available QGIS platform together with PostgreSQL as the database software.
- Client representatives and IT specialists will be trained on the use of the GSED and on procedures for maintenance and update of the data.
- The details of the GSED will be fully documented through the following products: (1) GSED User’s Guide; (2) Data Catalog, and (3) GSED Technical Manual.
Risk Profile and Atlas
The Risk Profile and Atlas (RPA) is a narrative of the city through the lens of resilience aimed at informing, educating and raising awareness at all levels: from the policy-maker down to the citizen. The RPA builds the interest of the reader on the city and facilitates knowledge transfer and risk communication.
The RPA includes a narrative on the city’s history, development patterns, important historical and cultural events, neighborhood structures, community engagement, demographics, natural environment, administrative structure, emergency management organization, disaster risk reduction activities and gains, and naturally key outputs of the CDRA. The information will be presented in a way that is easily accessible and educational, while at the same time accurate and scientifically correct.
Maps and charts, particularly hazard maps and hazard impacts maps are presented in large size maps (A3 format) and annotated to explain the nature and relevance of the data to the city.
The RPA is also an important public relations tool for the city, since it showcases the accomplishments of the city not only in the management of disaster risk, but also in productivity, governance, quality of data, and use of high resolution technology. It is a statement of the city’s commitment to excellence and service to all its constituents
Web-based Knowledge Sharing Platform
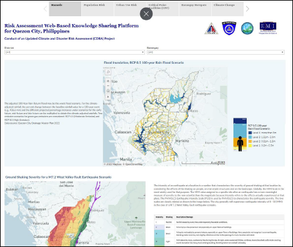
The web-based knowledge sharing platform enables effective real-time sharing of selected data of the GSED among the city's department and offices. This scales up the use of the data for various planning and decision-making purposes for the city avoiding confusion and inefficiency of using multiple sources of data. The emphasis is on the outputs of the CDRA. The architecture of the platform is flexible to accommodate multiple layers of data.
Information is presented in the form of a Storyboard. In a storyboard, multiple dashboards can be included, each with a specific theme and its own set of data. Dashboards can be composed of maps, charts, graphs, texts, or images. Navigation is intuitive, not requiring any specific technical skills. Users can find accurate answers to specific questions, such as: What is the displaced population by barangay for the worst-case flood scenario? or what are the hotspot barangays for earthquake, flood and combined hazards?
Indicator and Hotspots
Indicators are widely used for decision-making purposes. EMI has developed a number of indicator systems for understanding, prioritizing and benchmarking risk. The index used to determine the hotspot barangays is termed as the Neighborhood Vulnerability Index (NVI), which is calculated based on a combination of relevant vulnerability indicators representing physical and social vulnerability.
Hotpot neighborhoods are neighborhoods that represent the highest potential vulnerability for one or multiple hazards. The NVI was developed by EMI and is tailored to the particular geographical, physical and social considerations of each city. A selection of neighborhoods with the highest NVIs are identified as hotspot neighborhoods.
The selected indicators that comprise the NVI represent three separate characteristics of vulnerability to the hazards such as flood or earthquake, namely they represent the following risk quantities:
- The expected severity of the hazard of each barangay
- Impact on population such as loss of life, or displaced populations
- Aggravating land use constraints such as population density or road congestion
IEC Materials
Three Information, Education and Communication (IEC) products are produced to support raising awareness, facilitating communication and mainstreaming the outputs of the CDRA, namely:
- An audio-visual presentation (AVP)
- Infographics for each hazard, and
- Mini booklet.
Infographics answer frequently asked questions regarding the different hazards faced by the community and the impacts that could be experienced in case of an event. Topics discussed are characteristics of hazard, areas, population and key infrastructure that would be affected, and what to do before, during and after an event.
The mini booklet summarizes contents of the Risk Profile and Atlas and CDRA targeting the barangays and communities as audiences. It stresses preparedness and awareness by presenting the most relevant hazard charts and maps.
The audio visual presentation (AVP) is a short voice-guided learning tool through a video presenting the different hazards and important facts to remember when preparing and responding to disasters.
With these products, cascading information to the general public will have a consistent and effective message, using straightforward and easy to understand language.
Local Disaster Risk Reduction and Management Plan
The LDRRM Plan is based on the findings and outputs of two key analyses: 1) the CDRA and 2) the Legal and Institutional analysis (LIA). The latter provides a comprehensive understanding of the administrative arrangements in the city, the roles and responsibilities as far as DRRM, the level of compliances with the relevant regulations and with the international standards of practices.
The first step in developing the LDRRM Plan is to complete an exercise with the Technical Working Group (TWG) members on the Resilience Performance Scorecard. The outputs will establish an initial self assessment and provide initial benchmarks of the city’s DRRM and CCA policies and practices.
The second step is to complete a Situational Analysis to establish the current practice, resources, experience and competencies for each DRRM thematic area and each hazard.
The third step is to complete a Consequential Analysis using tools such as SWOC and impact assessment workshops to assess gaps against regulatory requirements and readiness levels to respond to CDRA impacts. This process results in identifying gaps in the current arrangements, processes, policies and practices.
The next step is the Plan Development through a co-development process with the stakeholders. A visioning exercise is completed together with strategies, programs, projects and activities (PPAs), result frameworks and implementation mechanisms for each theme and each hazard. Mainstreaming, monitoring and evaluation mechanisms together with indicators are also developed to complete the plan.
Local Climate Change Action Plan
Local governments have the responsibility to manage and maintain ecological balance through formulation, planning, and implementation of climate action plans within their territorial jurisdictions. Local Climate Change Action Plan (LCCAP) is one the derivative plans that can be incorporated to existing programs, projects, and strategies elaborated in established plans such as the CDP and the CLUP.
Contents and outline of a LCCAP are as follow:
- Background - provides summary of city's profile and establish the timeframe for LCCAP
- Climate Information - description of risks and vulnerabilities due to climate change considering impacts to population, basic services, economic activities, and when available explanation on GHG accounting
- Plan Objectives - presents development goals of the city’s and objectives of the LCCAP for adaptation and mitigation to impacts of climate change
- PPAs and Policy Requirements - briefs of adaptation and mitigation programs, projects and activities (PPAs), policy requirements, and cost of PPAs
- Monitoring and Evaluation - based on the PPA details, provides an M & E plan showing how accomplishments will be measured and evaluated with corresponding reporting mechanisms and point persons.
- Appendices - comprised of lists, tables and maps as referenced in the plan
EMI adopts Havard's design thinking approach to co-develop the LCCAP with the direct engagement and input from the stakeholders. The emphasis is to establish impacts of temperature and rainfall extremes on key sectors using the CERAM (Climate Extremes Risk Assessment Model) tool with city-specific climate extreme indices. The gaps are identified and PPAs are synthesized from the outputs of the CERAM and validated back with the stakeholders.
Community DRRM Plan
Oftentimes, communities do not have the resources or technical competencies to collect and interpret the data. EMI's approach is to facilitate and streamline the process in three ways:
- Create an online data capture tool to support the data collection process. Communities do not need to worry about the format and structure of the data. The template will automatically organize the data in the appropriate format.
- Create an online template to support the plan development process with a related guide. The step-by-step process will guide the communities in developing each phase of the plan providing guidance and examples.
- Train the stakeholders on the online tools and on any government’s requirements, and provide them with relevant hazard maps.
- Co-design a model community DRRM plan to serve as a prototype to be followed as well as a training exercise.
- Establish an online mentoring and guiding system, to support the communities in the plan co-development process at each step.
A plan formulation and finalization workshop enables the communities to complete their plans, identify and prioritize programs, projects and activities (PPAs), define strategies, outputs and outcomes and establish the results frameworks to evaluate the effectiveness of each plan.
Integrated Emergency Management System
EMI will put its 20 years of experience to design and implement a state-of-the-art Integrated Emergency Management Systems (IEMS) for your city. The Integrated Emergency Management System (IEMS) is a global, structured, and results-proven approach that puts the guessing out of managing all types of emergencies.
It is the foundation for organizing and conducting an effective crisis and disaster response. It equips emergency managers with the organization, skills and equipment to act quickly, communicate effectively, make the appropriate decisions and optimize resources when a disaster hits. It is rooted in the principles of the Incident Command and Emergency Support Function systems (which are proven international benchmarks) that provide a common operating picture and allow for a more organized and effective emergency response. It provides a framework for the continuous improvement and for the institutionalization of coordination mechanisms and decision-making processes for emergency response planning and operations.
Emergency managers are at the front lines for response. The IEMS leaves no room for errors, confusion or waste of time and resources.
Concept of Operations / Standard Operating Procedures / Emergency Operations Plan for the EOC
The ConOps Manual and SOP Handbook are two essential documents that define the EOC operations. The ConOps elaborates the vision, policies, principles, objectives, organization, and framework for the EOC operations. The SOPs describe the legal authorities, planning processes, and the procedures for all response personnel before, during and immediately after an incident under the Incident Management System. It describes the processes and actions required of individuals who are responsible for setting up, activating and operating the EOC.
The ConOps and the SOP handbook are the core elements of the Emergency Operations Plan (EOP). The other element is the Emergency Support Functions (ESFs). In the UN system, the ESFs are referred to as "Clusters". The clusters indicate the grouping of institutions (public and private) along similar functions to support and coordinate the response.
Training Exercises and Drills (TED) for Emergency Response and Recovery
The scope of TED is:
- Design and implement a structured training program comprising a series of skills and training courses to build competency in the field of emergency response.
- Design and conduct a series of exercises and drills aimed at operationalizing and testing existing Emergency Operation Plan (EOP), levels of competencies, communication facilities, and improving coordination and efficiency of operations among key stakeholders.
- Co-design the ConOps and the Standard Operating Procedures (SOPs) with the key stakeholders.
- Train on the structure of the Emergency Operations Center (EOC) and the protocols for its operation and management.
- Identify improvements in the emergency response and relief system.
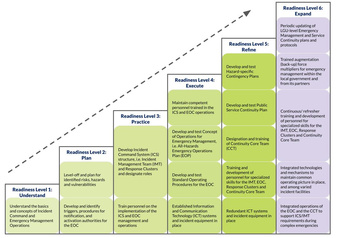
TED is implemented on a building block approach using a series of highly interactive training sessions, exercises, and drills divided into modules to help the city in achieving specific target Readiness Levels and supported by Emergency Management Competency Indicators for each Readiness Level to measure gains in key knowledge, skills, and experience related to the outcomes of each module.
Public Service Continuity Plan / Contingency Plan
EMI adopts its design-thinking approach to co-develop the PSCP (and CPs) with the relevant stakeholders. It would require as many as three workshops with the stakeholders. One important aspect is to define the worst-case scenarios from the results of the CDRA.
- The deliverables include:
- Complete PSCP/CP validated and co-developed with the stakeholders.
- Implementation and maintenance procedures of the PSCP/CP.
- Outputs of the testing of the PSCP/CP.
- Training (if requested).
Disaster Information Management System
Disaster Information Management System (DIMS) is a sophisticated software package that provides disaster monitoring, situational awareness, decision support, and information exchange capabilities to disaster management decision makers. It includes real-time or near real-time capabilities for visual displays, resource monitoring, and reporting.
EOC Facility Design Including IT System and Resilient Telecommunication
Includes the following:
- A 3D rendering of the EOC prototype design to accommodate the IEMS operations for the city. A concept design is provided as a reference to be further designed by a competent architectural firm.
- A prototype design of the telecommunications system, which is fully resilient and can provide for voice, data, and video capabilities on and off the grid.
- Hardware architecture, design and specifications for the data center (or server) to support the full operations of the EOC
Roadmap and Tools for Managing Complex Emergencies
At a local government level, both incident management (IM) operations and Mission Essential Functions (MEFs) are commonly performed by similar key actors. This requires that personnel and departments/offices involved in both operations (i.e., IM and MEFs) understand their roles and responsibility under each of the operations during complex emergencies where both functions would be active. The term “complex emergencies” can be referred to as the occurrence of emergencies caused by simultaneous or successive major hazard events with impacts on the general population, infrastructure and environment, thus affecting a city's capacity to continue the delivery of its MEFs.
The Scenarios and StoryMaps would test the ability of the city to continue providing the identified MEFs defined in its plan/s during a Simulation Exercise (SimEx). The results of the SimEx will help inform the enhancement of the ensemble of incident management plans (e.g. emergency operation plans, contingency plans, standard operating procedures). The StoryMaps will be composed of several major incidents, each containing several simultaneous scenarios. Each major incident will be given to the participants separately to add an element of surprise prior the start of the allocated period for the incident.
Guide questions will be provided to help participants use a common lens in understanding the scenarios from the start of each event, and help them generate more meaningful responses and outputs.
A short evaluation session will be conducted after the allotted period for each event. This evaluation session will be dedicated to sharing of answers to the guide questions in order to evaluate if participants were working on a common operating picture as they complete their assignments. This will be an opportunity for facilitators to address common issues and questions from participants, and provide guidance/adjustments as needed.
Contact us: